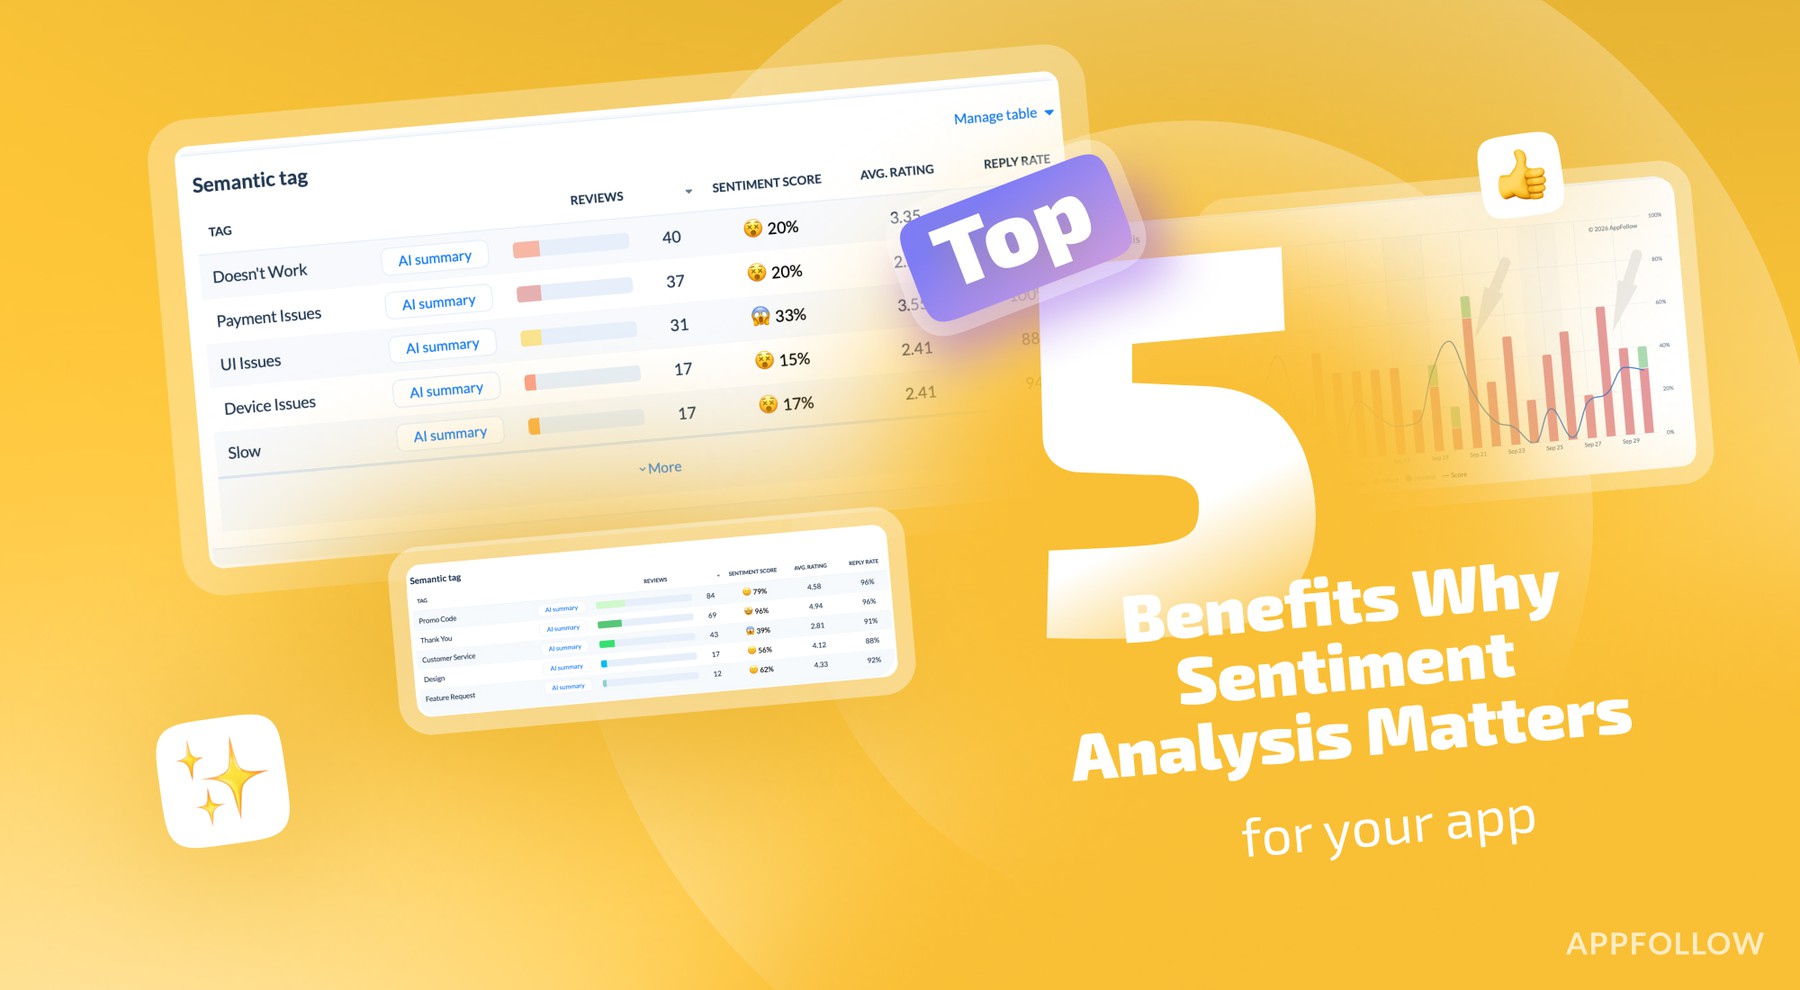
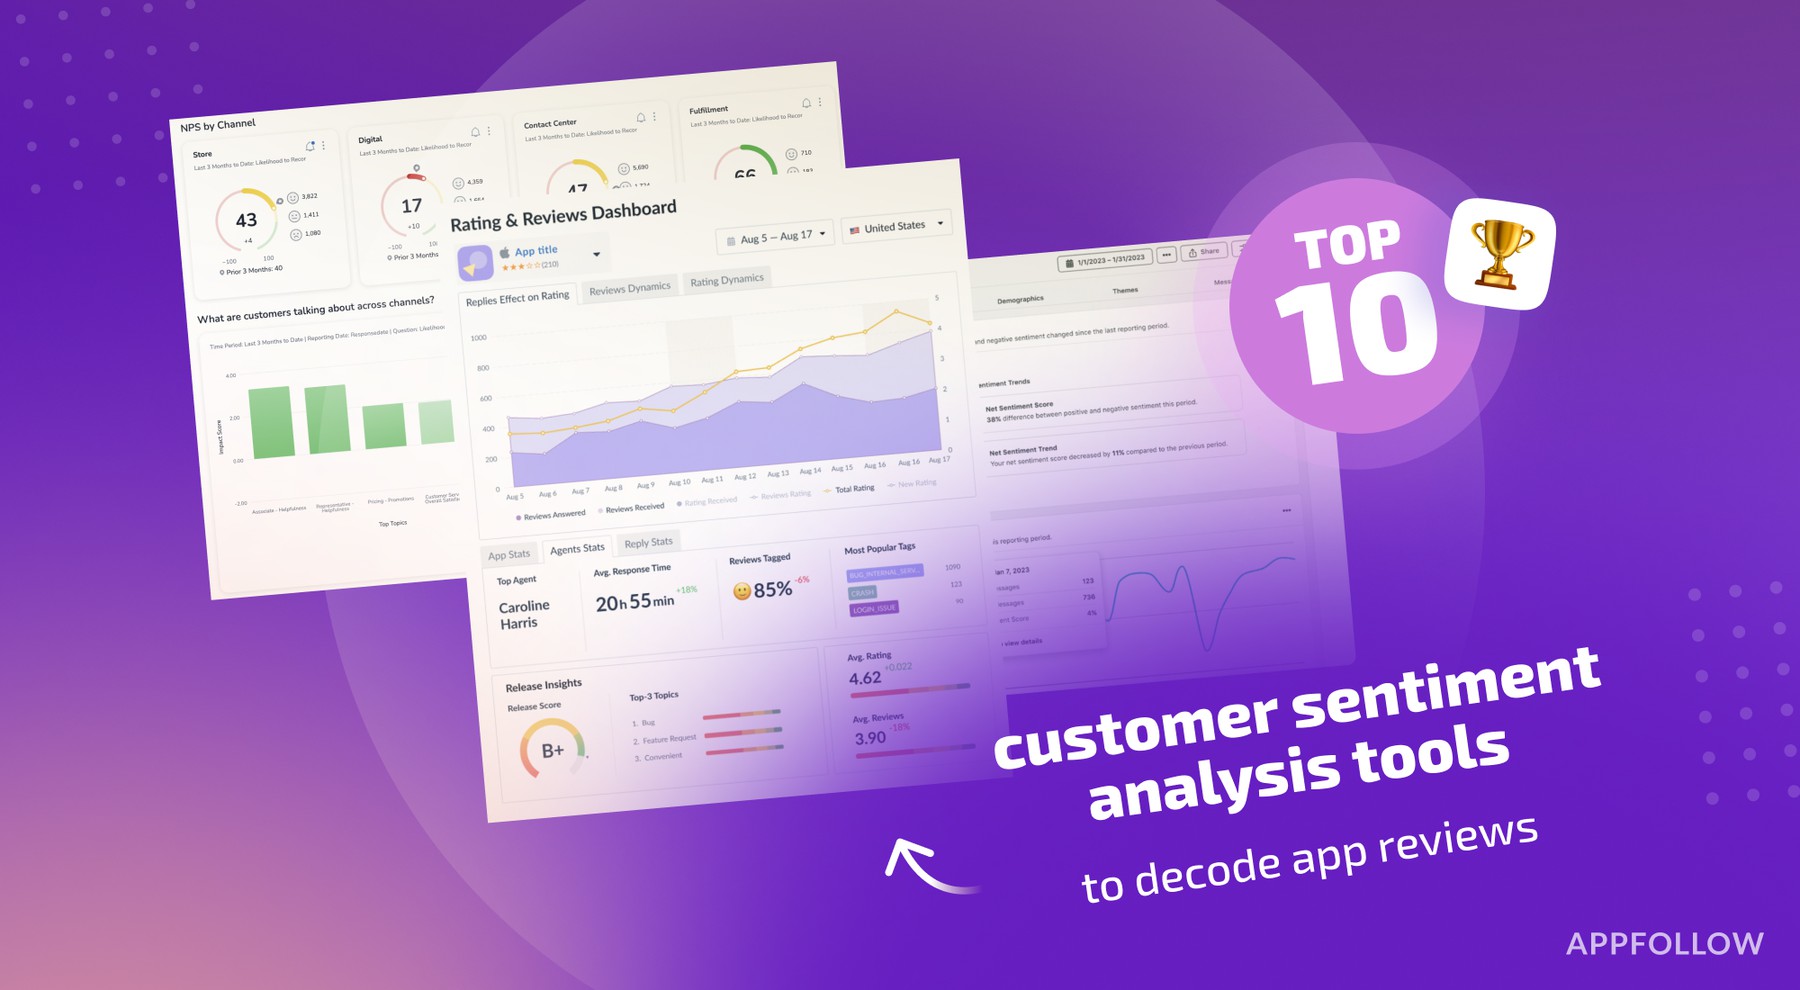
Ratings & Reviews performance provides an overview of what users think of your app. Here are the key metrics to help you identify how your app is rated by users and how successful is your review management strategy.
In probability and statistics, Student's t-distribution (or simply the t-distribution) is any member of a family of continuous probability distributions that arises when estimating the mean of a normally distributed population in situations where the sample size is small and population standard deviation is unknown. The Student’s t-distribution app has three data input parameters - the Number of Degrees of Freedom (range 2-20), a Step Size parameter for evaluation points for the PDF and CDF Distributions and the Percentile parameter. The Student’s t Distribution app also displays a touch enabled graph for the x/f(x) generated values. The graph is touch enabled graph. Upon touching the graph a vertical line appears. Move the vertical line to the left or right to display the point x/f(x). The horizontal x-axis displays x values. The vertical y-axis plots a range of either the x-increment and y-increment values Horizontal Max and Min dashed lines display the Maximum and Minimum values.Automatic incrementing of the value.