Ratings & Reviews performance provides an overview of what users think of your app. Here are the key metrics to help you identify how your app is rated by users and how successful is your review management strategy.
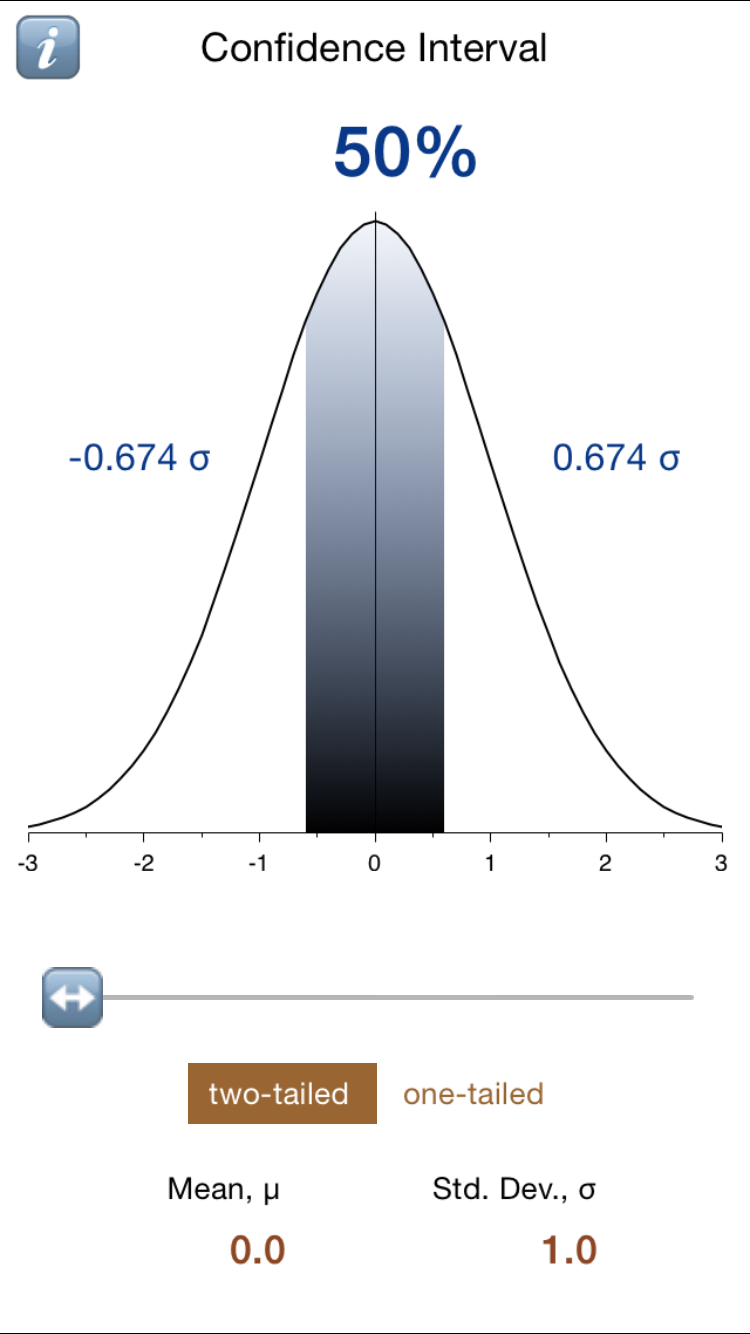
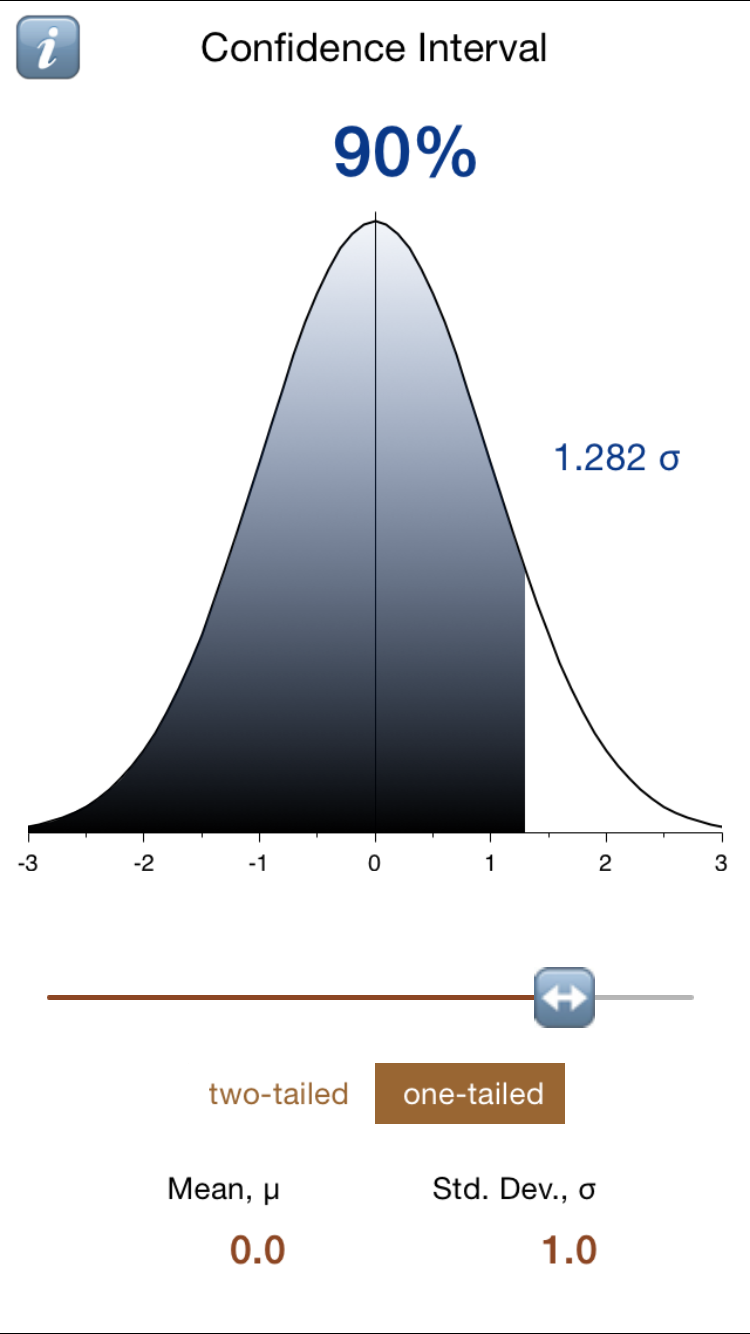
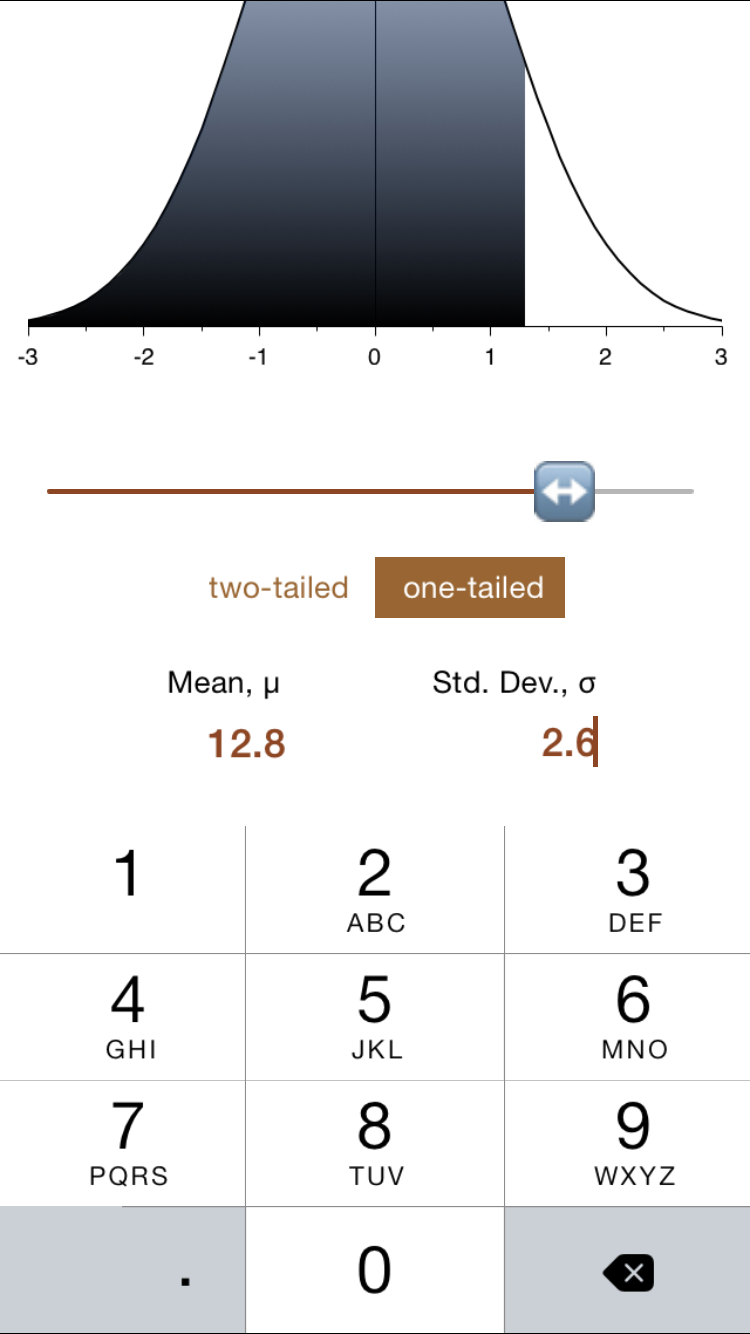
In statistics, confidence intervals can be used to express the degree to which sample results are reliable. Confidence intervals are often stated in terms of a percentage like 90% or 95%. When the sample or population distribution is the Normal (bell-shaped) distribution, the confidence intervals can be represented as a number of standard deviations (σ) above or below the sample mean (μ). Moving the slider beneath the graph will vary the confidence intervals from 50% to 99%. Additionally, you may choose the two-tailed confidence intervals or the one-tailed interval by tapping the button beneath the slider. In this application, you may chose the standardized Normal distribution with μ=0.0 and σ=1.0 or some other values for mean and standard deviation.