Ratings & Reviews performance provides an overview of what users think of your app. Here are the key metrics to help you identify how your app is rated by users and how successful is your review management strategy.
User reviews affect conversion to installs and app rating. Featured and helpful reviews are the first to be noticed by users and in case of no response can affect download rate.
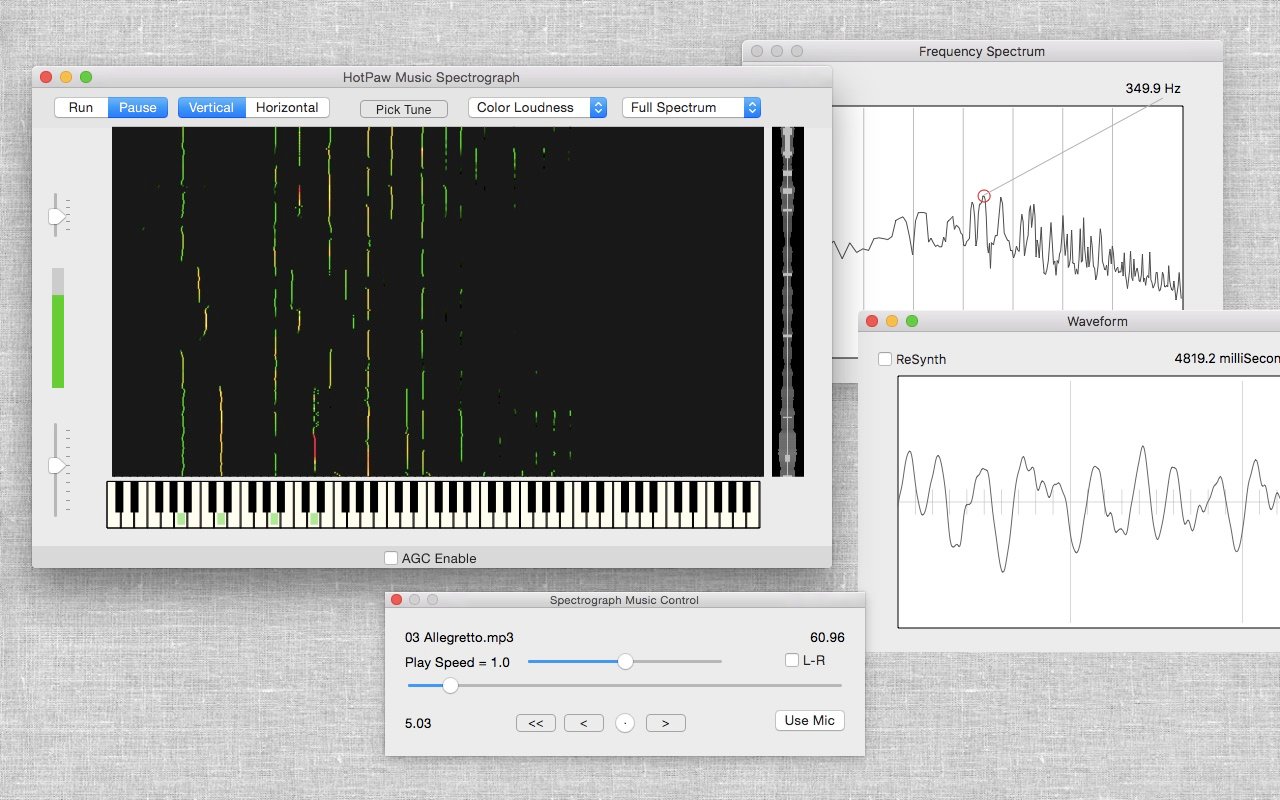
HotPaw Piano Roll Music Spectrograph - A Visual Music Transcription Assistant This is a Mac OS X version of the HotPaw Music Spectrograph app for iOS devices. Visualize and reverse engineer sound and music. The Music Spectrograph displays music and sound as it might appear on a live piano-roll or MIDI/Music editor. The scrolling graph is of music pitch frequencies versus time. This form of sound visualization can assist with the transcription of music (but only if you ignore harmonics and overtone frequencies). In addition, you can also slow down the audio play rate to make it even easier to transcribe music, or even freeze music in time, using a built-in custom audio re-synthesis mode. The HotPaw Musical Piano Roll Spectrograph creates a scrolling 12th-octave MIDI pitch-centered spectrogram, either from microphone input or synchronized with playing a sound or music file. To analyze a song in your iTunes library, hit the "Pick Tune" button and choose a music file. Hit the "Use Mic" button on the Music Control panel to switch back to analyzing live audio. Features include: - 12th-octave MIDI-pitch-centered spectrograph (also called a sonogram) - Speed up or slow down music play, or even freeze sound in time. - Color frequencies to see if they are in-tune or out-of-tune - Color frequencies for loudness, or graph in black-and-white Music playback during spectrograph analysis is monophonic only, as only 1 channel is visualized. To help remove vocals on many common pop tune mixes, you can select L-R in the Tunes display. The current version of the Music Spectrograph application is limited to up to 10 minutes in length of music for MIDI visualization. Not all iTunes file formats supported. DRM protected music files are not supported. Please Note: For most musical sounds, you will see LOTS of overtones and harmonics, not just the fundamental note pitch frequencies. Some musical expertise will be required to separate the actual notes from among this series of overtones. Drums and percussion in common pop, rock, and jazz music can also fill the spectrum with wideband noise that can hide the pitch of other instruments, including any melody.