Ratings & Reviews performance provides an overview of what users think of your app. Here are the key metrics to help you identify how your app is rated by users and how successful is your review management strategy.
User reviews affect conversion to installs and app rating. Featured and helpful reviews are the first to be noticed by users and in case of no response can affect download rate.
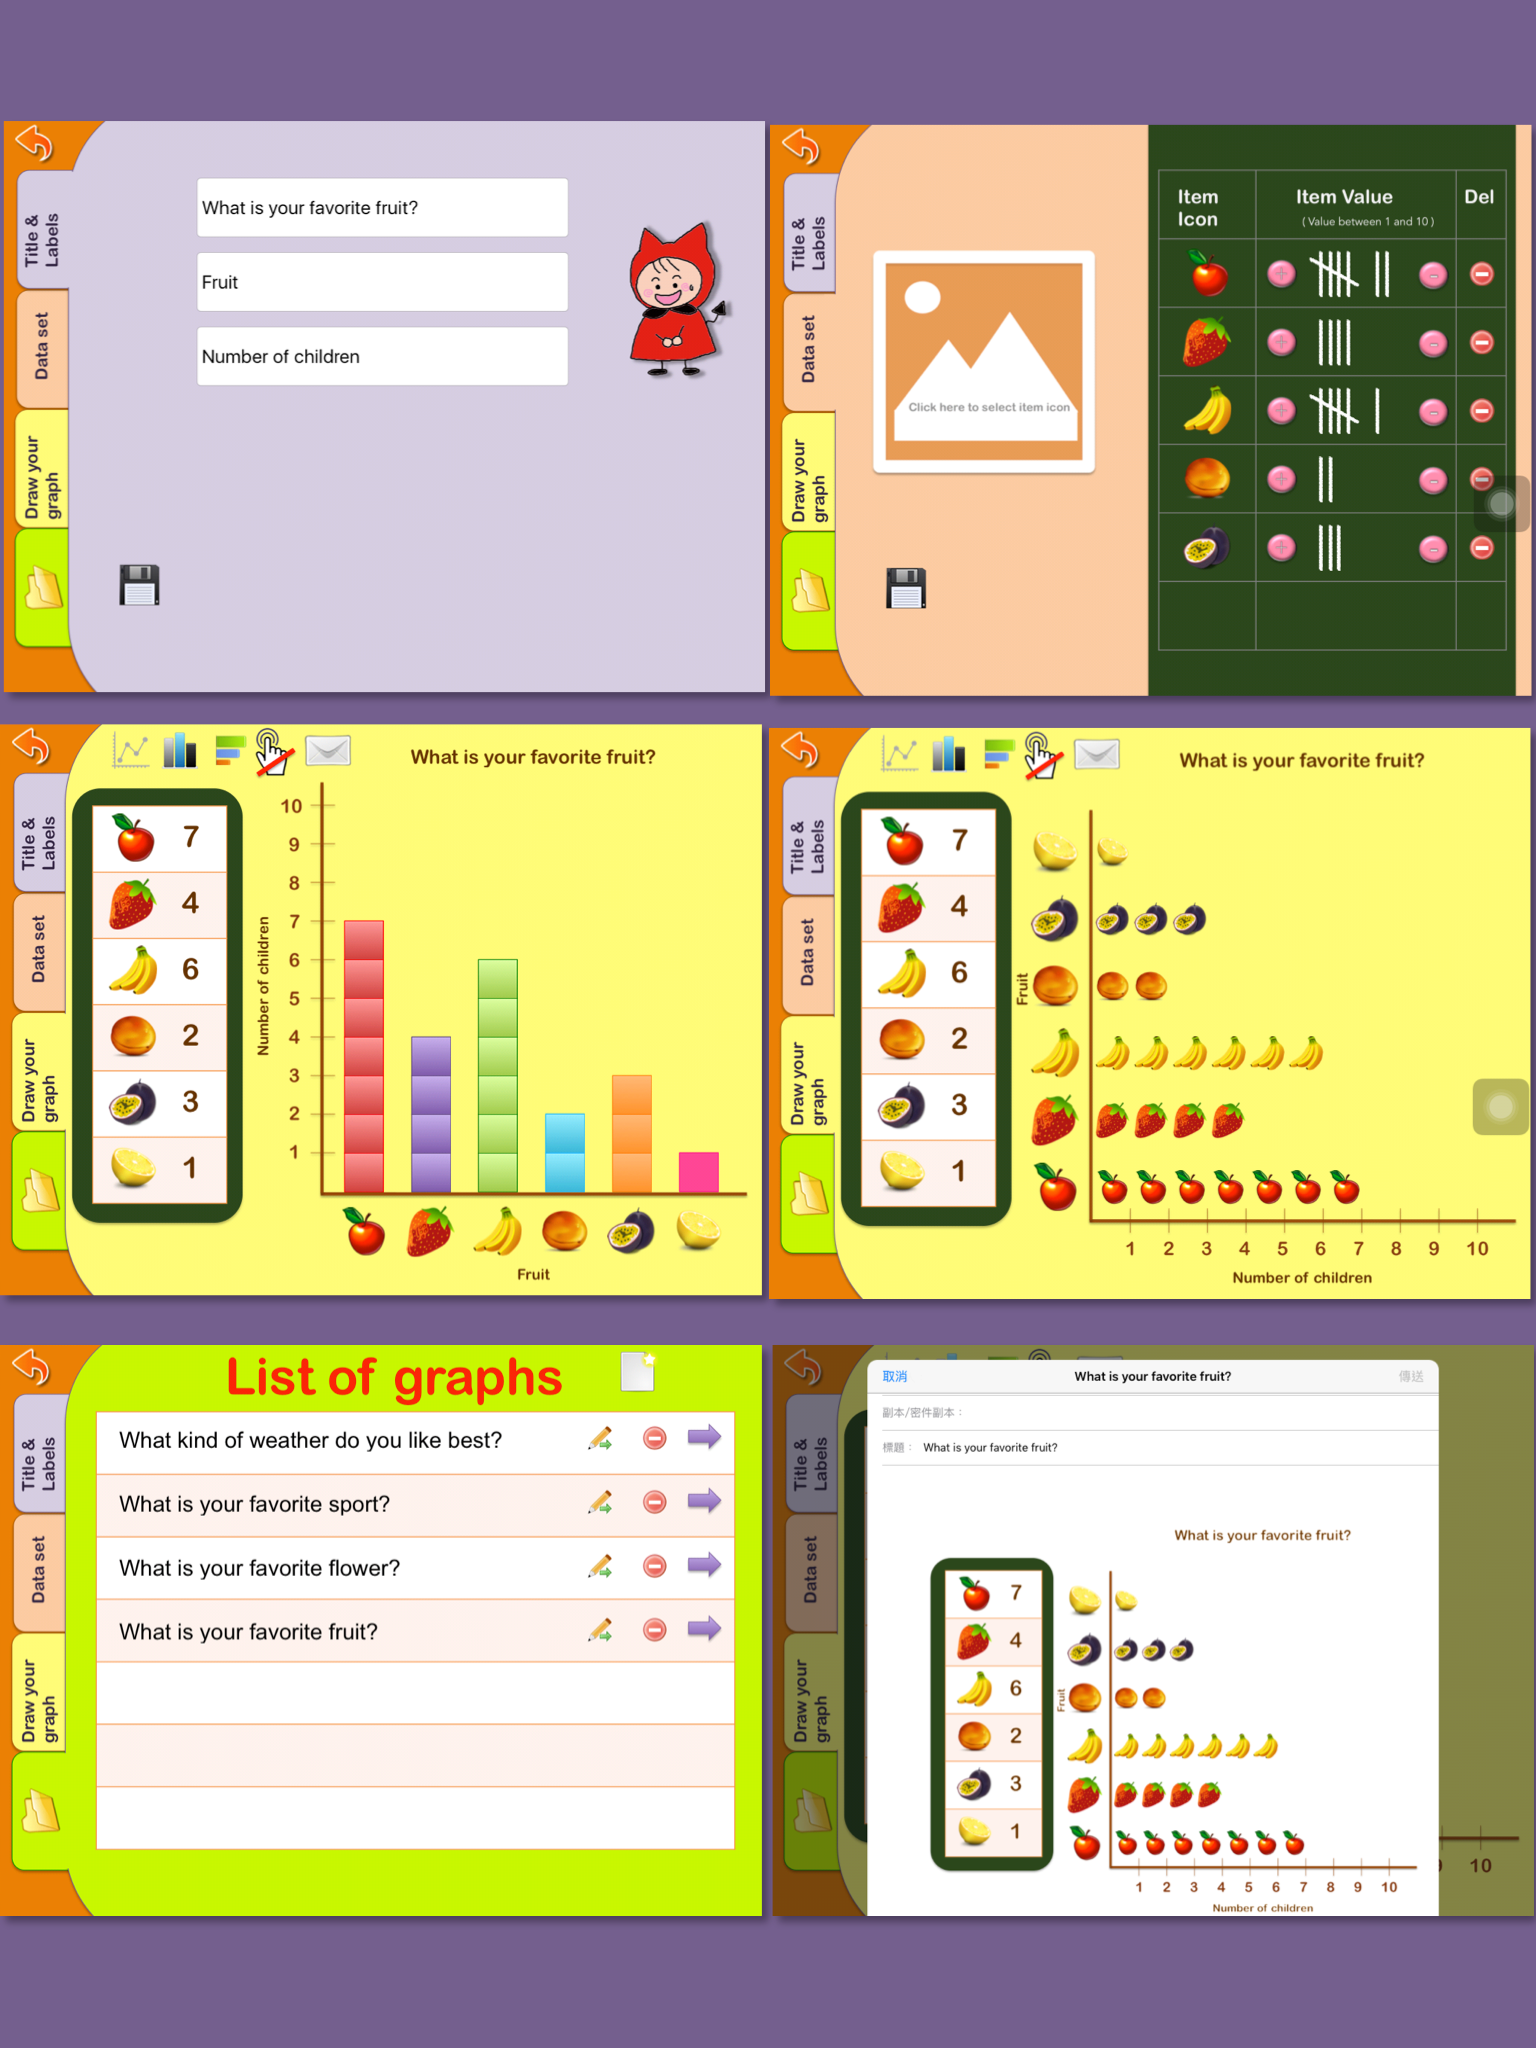
Graphing for kids app provides teachers and students with an easy graphing learning tool. This app has 3 parts: one is "How to make a chart", one is "Chart Maker", and the other is "Create my chart". The "How to make a chart" section provides step-by-step learning material to teach kids how to draw a chart. The "Chart Maker" is an easy tool for kids to input data and make a chart. The "Create my chart" function allows students to use their own pictures and text to create graphs. The Email feature makes it easier to print reports. In the "How to make a chart" part, you can learn how to make: Bar graph Line graph Pie graph Pictographs In the "Chart Maker" part, you can make: Bar graph Line graph Pie graph Horizontal bar graph In the "Create my chart" part, you can make (Thanks for Nancy Bley's suggestion): Bar graph Line graph Pictographs Chart Maker demo : https://www.youtube.com/watch?v=7dEczE1tIEU Create My Chart demo: https://www.youtube.com/watch?v=BnoEF3FP-kc You can search for icons through the internet. For example, search the keyword "find icon sport" to find transparent background icons for your chart. If you need help, please contact us by email: kids17fun@gmail.com