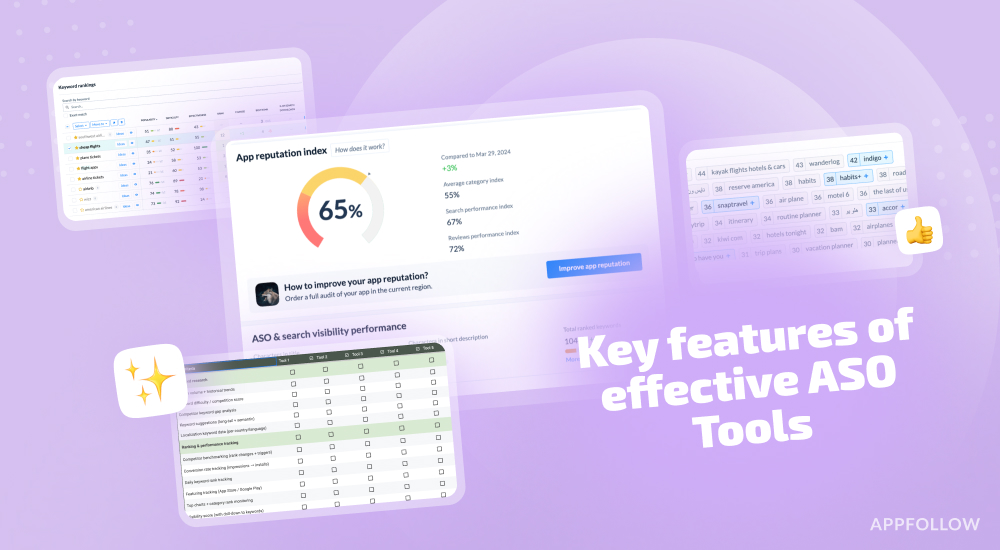
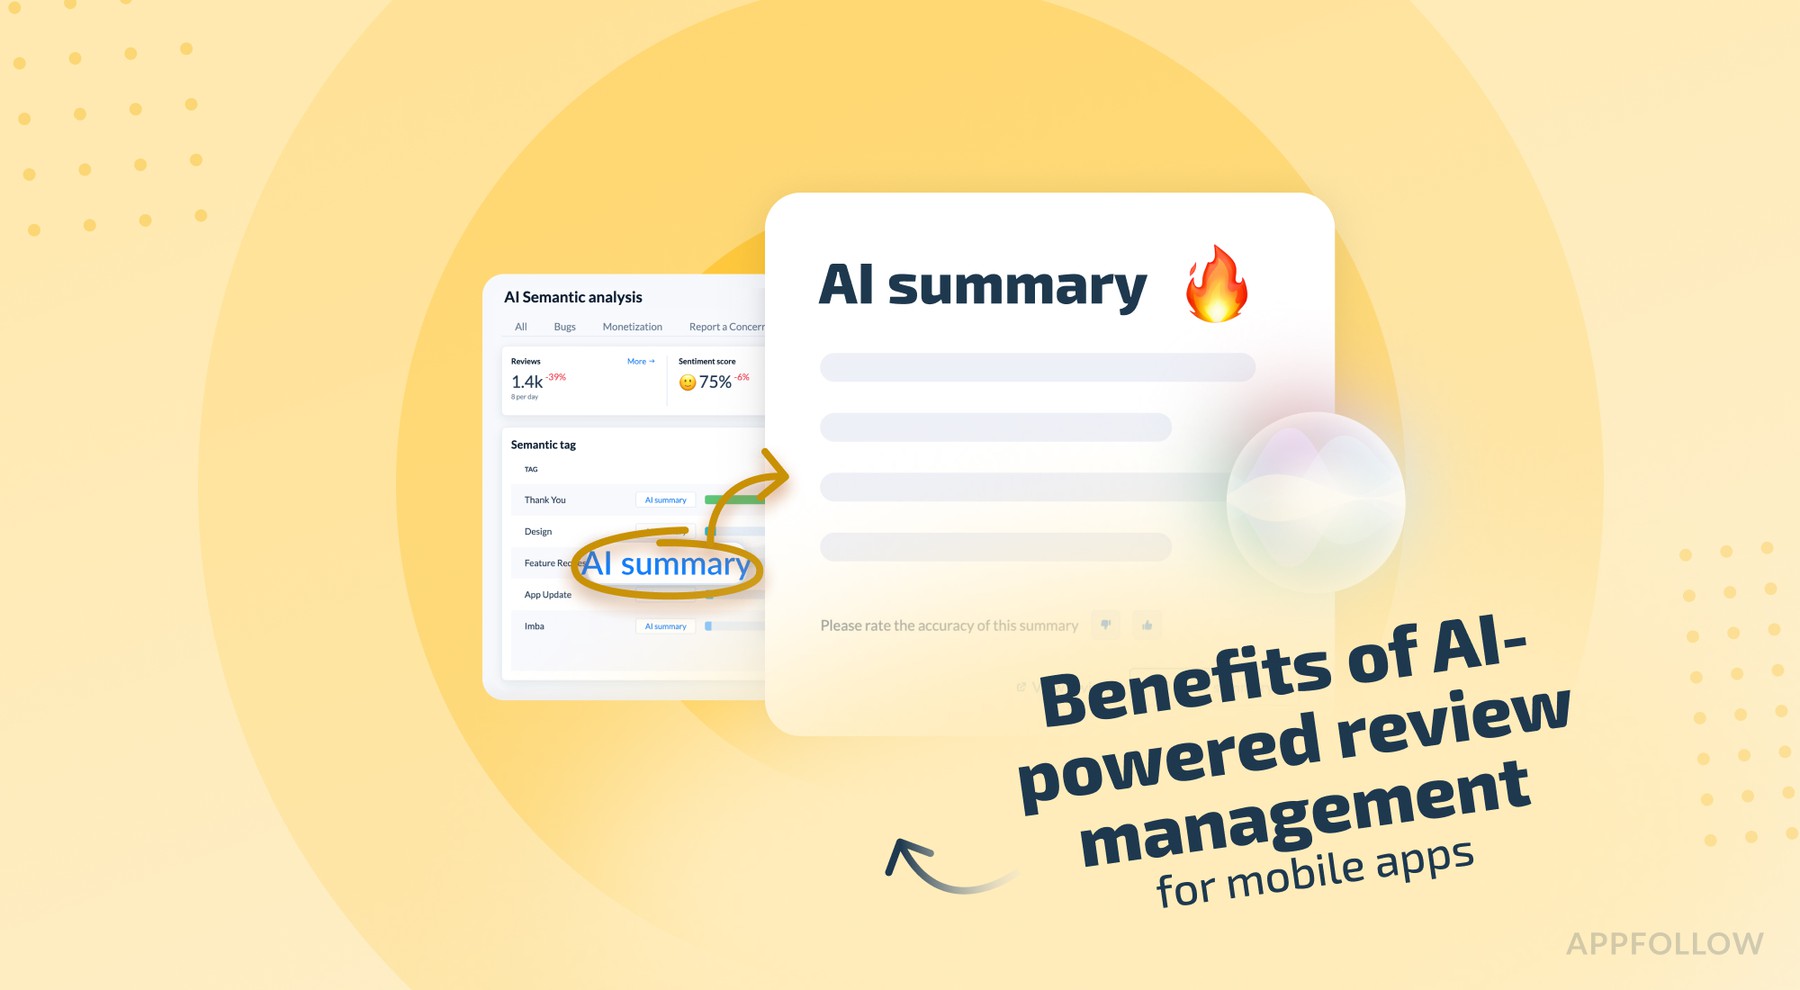
Ratings & Reviews performance provides an overview of what users think of your app. Here are the key metrics to help you identify how your app is rated by users and how successful is your review management strategy.
Graph is straightforward: • Makes graphs from numbers. • Made by the data visualization expert - VVI®. • Touch-hold a graph to email, print or save to your Photo Album. • Plenty of built-in options. • AirDrop your graph to the most powerful data visualization application on the iPad, Graph IDE. FEATURES • Includes several 1D, 2D and 3D graph types such as bar, column, pie, line, area, scatter, 3D perspective scatter, trajectory and surface, volumetric, z-sliced cell, maps, linear, semi-log, x-log, log-log, polar, r-log, Gregorian date and many variations. • Data is pasted from the pasteboard and inserted and edited using a table interface. • Touch-hold a graph to export it to Graph IDE on the iPad. Graph IDE is the most powerful data visualization application for the iPad and gives access to a wide variety of graph types and graphical effects. (Graph IDE is separately available for the iPad). • Touch graphs to rotate, zoom, scroll and scan data. • Touch data graphics, such as lines and bars, to show data values. • Touch-hold a graph to copy, print, mail, AirDrop and save it to other applications. • Data and preferences are organized by project and each project is persistent and automatically saved so you can show and retrieve your settings and data on subsequent use. NOTE: Continued use of GPS running in the background can dramatically decrease battery life. The Location Tracking task requires GPS for its function. ADD-ON The in-app purchase enables the Least Squares, Error Bars, Location Tracking, Weight and Health tasks and removes ads.