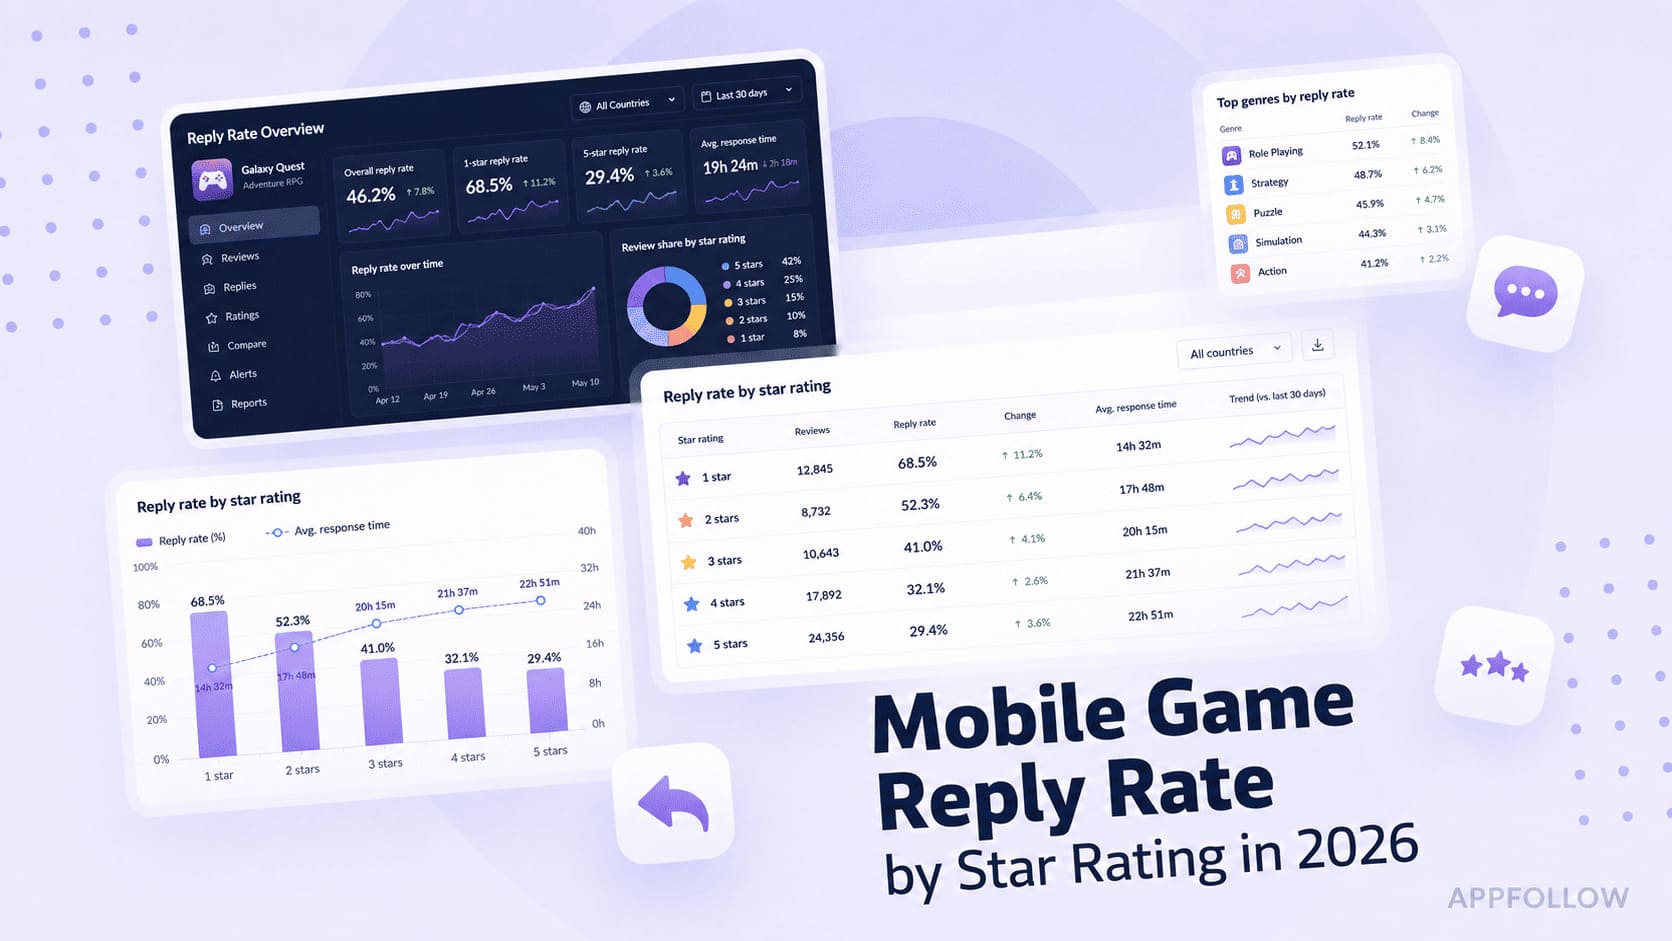
Ratings & Reviews performance provides an overview of what users think of your app. Here are the key metrics to help you identify how your app is rated by users and how successful is your review management strategy.
 4.8
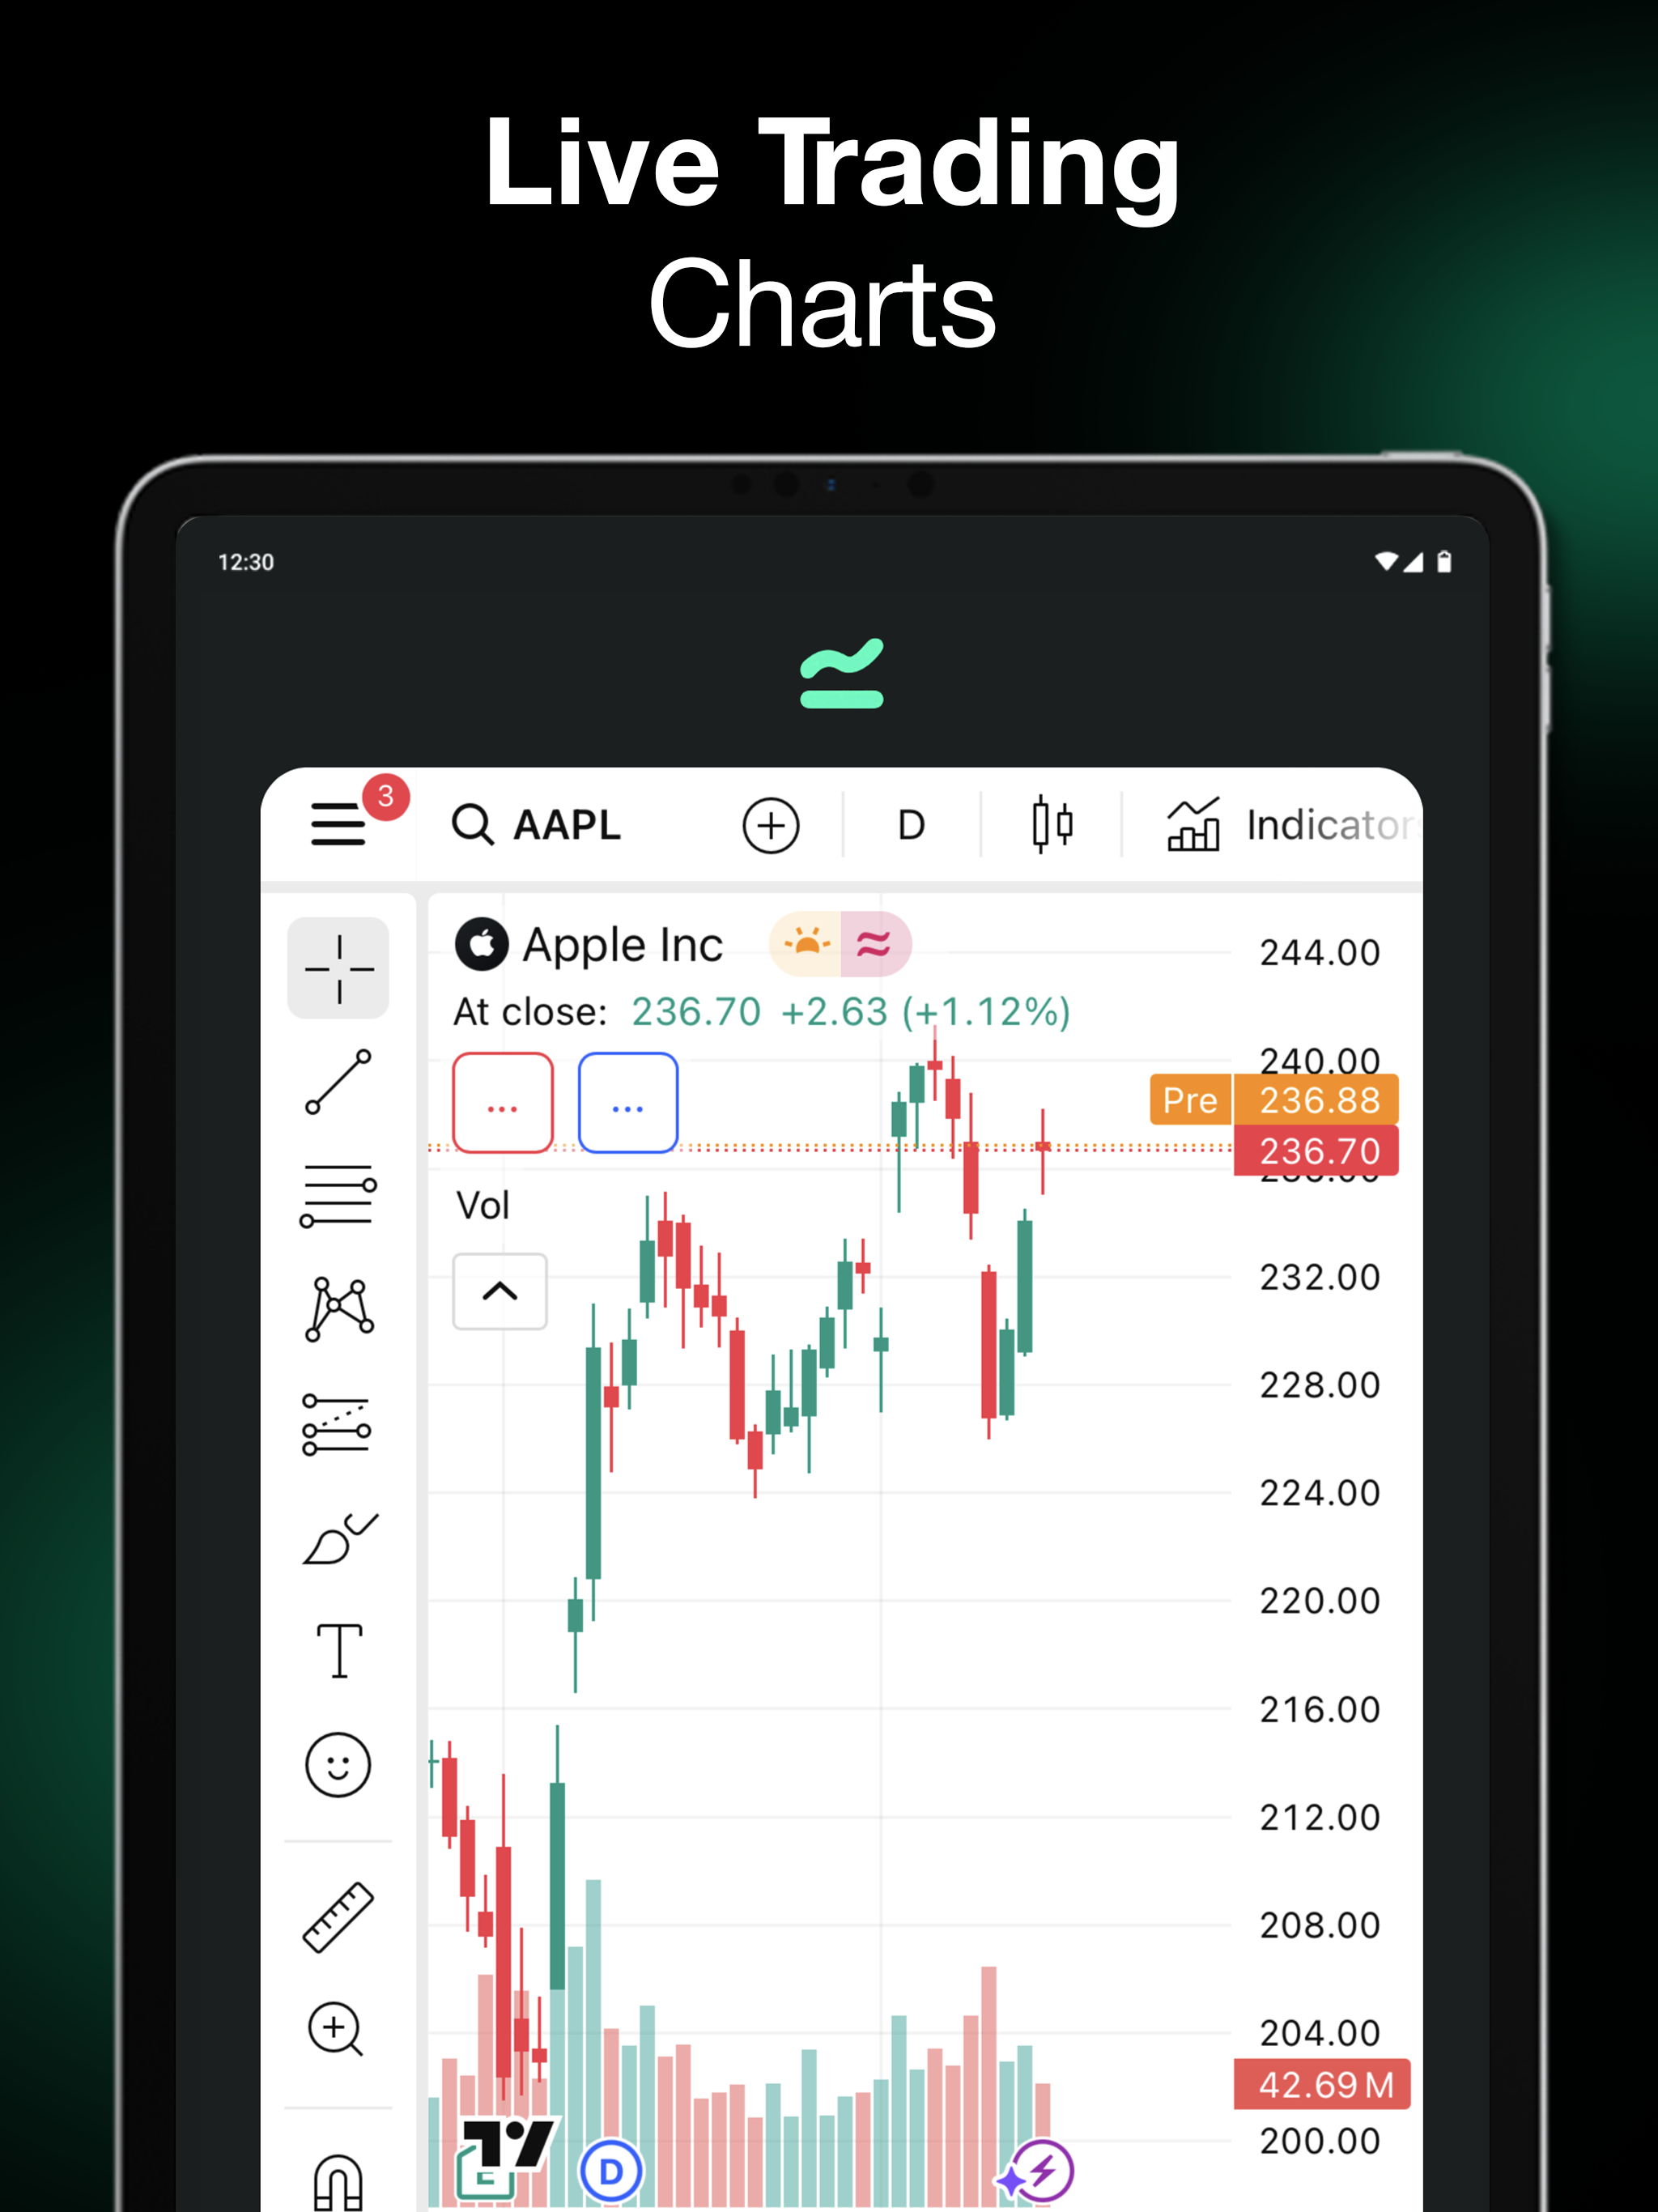
4.8+ AI-Powered Trading Chart Analysis Analyze trading charts in seconds with advanced AI-powered technical analysis. Whether you're a beginner or an experienced trader, get instant insights from chart patterns, indicators, support and resistance levels, trend analysis, and market structure. Simply upload a screenshot of your trading chart, and the app will generate an easy-to-understand technical analysis to help you make more informed trading decisions. - Features • AI-powered chart analysis • Detect bullish and bearish trends • Support & resistance identification • Candlestick pattern recognition • Trendline and breakout analysis • Moving Average, RSI, MACD and indicator interpretation • Chart pattern detection including Head & Shoulders, Double Top, Double Bottom, Triangles, Flags, Wedges, Channels and more • Risk and reward evaluation • Entry, take-profit and stop-loss suggestions • Multi-timeframe chart analysis • Fast and accurate AI insights • Clean and easy-to-use interface - Perfect For • Forex traders • Stock market investors • Cryptocurrency traders • Futures and commodities traders • Day traders • Swing traders • Long-term investors Our AI helps you understand price action, market trends, momentum, and technical indicators, making chart analysis faster and easier than ever. Subscription required: $3.99/week or $9.99/month. -Disclaimer- This app provides AI-generated technical analysis for educational and informational purposes only. It does not provide financial, investment, or trading advice. Trading financial markets involves risk, and past performance does not guarantee future results. Always conduct your own research before making investment decisions. For more information, see our: https://itechgemini.com/chartai-privacypolicy/ https://itechgemini.com/chart-ai-terms-of-use/