Ratings & Reviews performance provides an overview of what users think of your app. Here are the key metrics to help you identify how your app is rated by users and how successful is your review management strategy.
 5.0
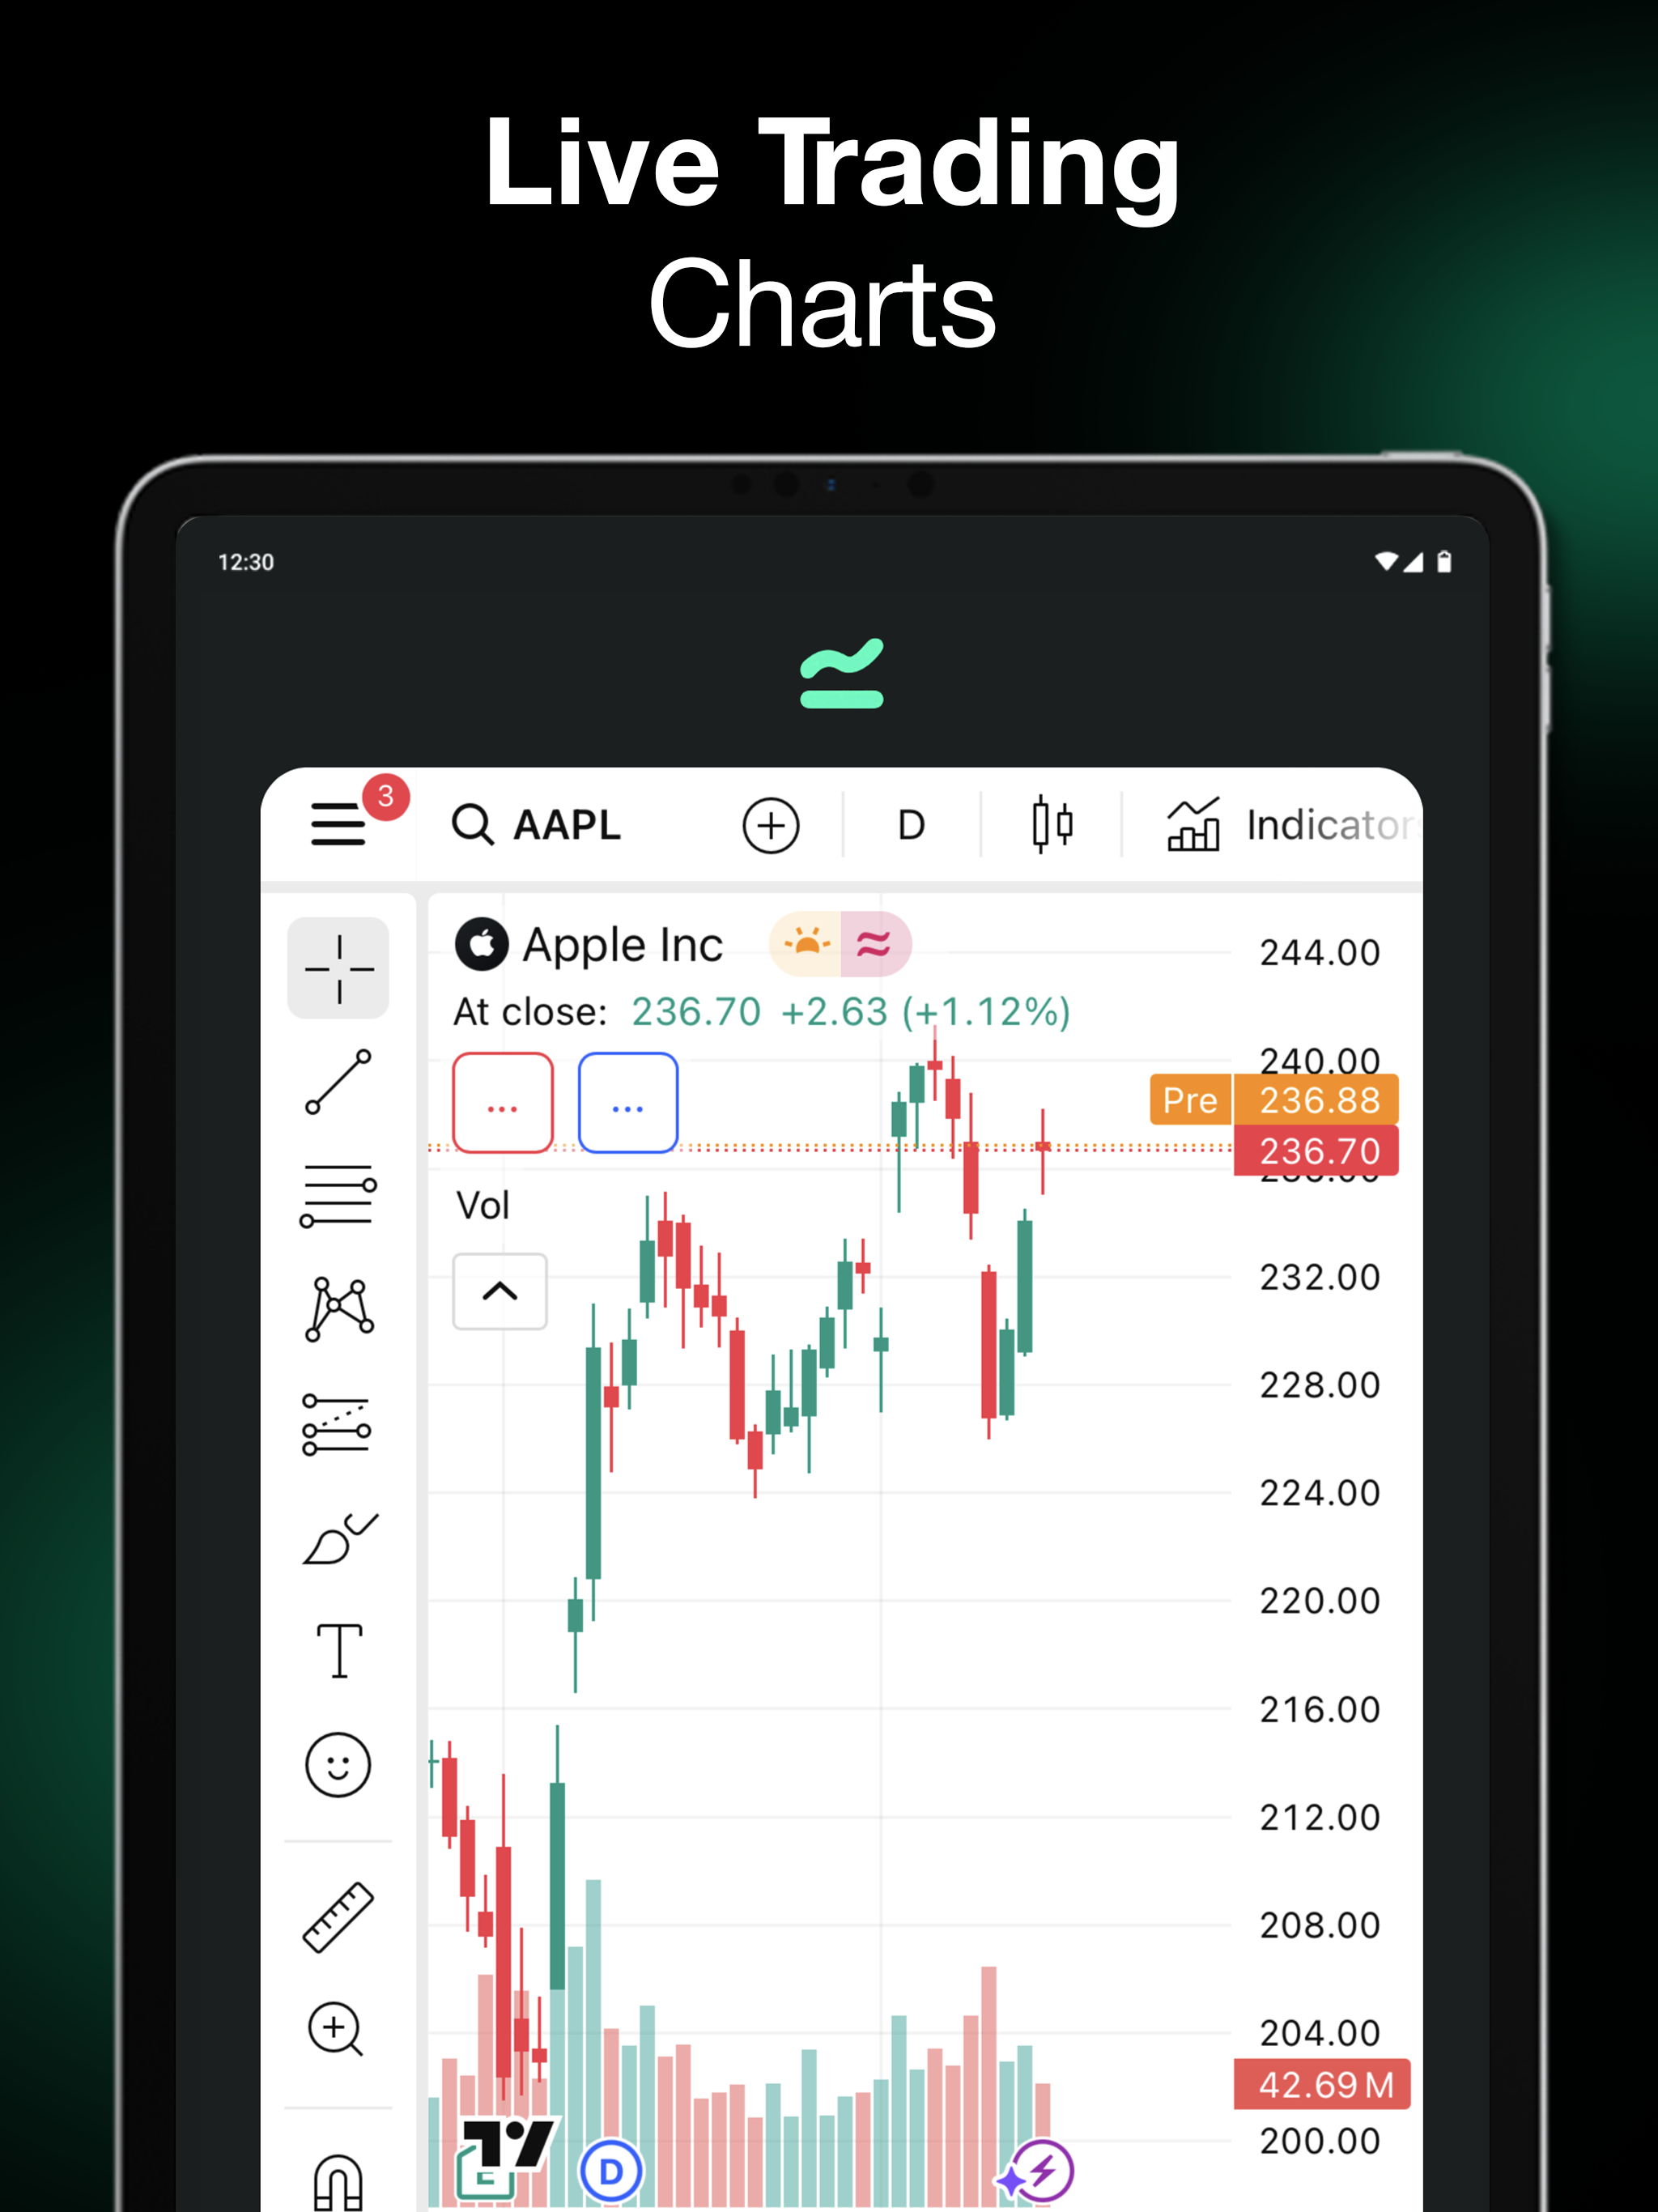
5.0Chart AI is a visual learning companion for anyone who wants to understand what a market chart may be showing. Upload an image and review an organised explanation of candlesticks, price structure, trendlines, support and resistance zones, technical indicators, and market sentiment. Each feature is presented as a learning aid so you can build chart-reading knowledge at your own pace. TURN A CHART INTO A LEARNING MOMENT A single chart can contain several layers of information. Chart AI helps separate those layers and explain what each one represents, creating a focused starting point for further study. WHAT YOU CAN EXPLORE • Upload a chart image for an AI-assisted educational review • Learn how common candlestick formations are described • Examine visible trends and price structure • Review possible support and resistance areas • Explore technical indicators and what they are commonly used to measure • Consider market sentiment and contextual information • Study examples across stocks, forex, and crypto markets • Return to important concepts whenever you need a refresher Canadian users studying stocks, forex, or crypto can use the app to bring chart concepts together in one place. It is suitable for beginners building a foundation as well as more experienced learners who want a quick, structured way to review a chart before doing their own research. A SIMPLE STUDY WORKFLOW 1. Choose a clear chart from your device. 2. Upload it to begin the analysis. 3. Read the explanation section by section. 4. Compare the observations with the original image. 5. Use the result as a starting point for deeper learning and independent research. LEARN WITH MORE CONTEXT Chart reading is not about one pattern or indicator in isolation. Time frame, price structure, volatility, sentiment, and broader conditions can all affect interpretation. Chart AI presents several relevant chart elements together, making it easier to build vocabulary, notice relationships, and ask better questions as your knowledge develops. Examples can be applied across Canadian and international markets, helping you focus on transferable chart-reading skills. CLEAR, EDUCATIONAL POSITIONING The app explains concepts in accessible language. It does not promise outcomes, replace your own judgement, or remove market uncertainty. Use the information to practice observation, strengthen your understanding, and continue learning from reliable educational sources. IMPORTANT INFORMATION Chart AI provides educational and informational content only. It does not provide investment recommendations or personalized financial guidance. Market activity involves risk, and any decision should be based on your own research, circumstances, and, where appropriate, guidance from a suitably qualified professional.