Ratings & Reviews performance provides an overview of what users think of your app. Here are the key metrics to help you identify how your app is rated by users and how successful is your review management strategy.
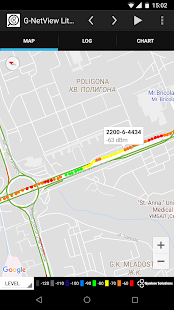
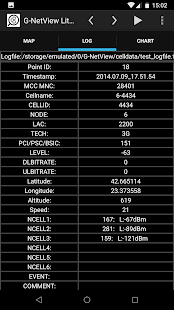
G-NetView Lite is an Android app for viewing and analyzing G-NetTrack logfiles. Features: - logfile points visualization on map - different thematic maps - LEVEL, CELL, TECH, SPEED, ALTITUDE, NEIGHBORS LEVEL - measurement point info - measurements charts - export of measurement charts in html format to be viewed on desktop browser - logfile player - floorplan load for indoor measurements Get Pro version for more features like: - using cellfile with cell information - serving and neighbor cell lines visualization - more thematic maps - QUAL, PCI/PSC/BSIC, SNR, BITRATE, SERVING DISTANCE, SERVING BEARING, SERVING ANTENNA HEIGHT, ARFCN, TEST PING, TEST BITRATES, NEIGHBORS QUAL - measurement point extended info - measurements histogram statistics charts - export of measurement statistics in html format to be viewed on desktop browser G-NetView Pro - https://play.google.com/store/apps/details?id=com.gyokovsolutions.gnetviewpro How to use: 1. Load logfile - select your text logfile to open it. In folder G-NetView/celldata there is a sample test_logfile.txt. 2. Use buttons to play logfile or select a point to see measurements. 3. In LOG tab you can see measurements for selected point. 4. In CHART tab you can view the measurement charts. Use buttons to move or zoom.