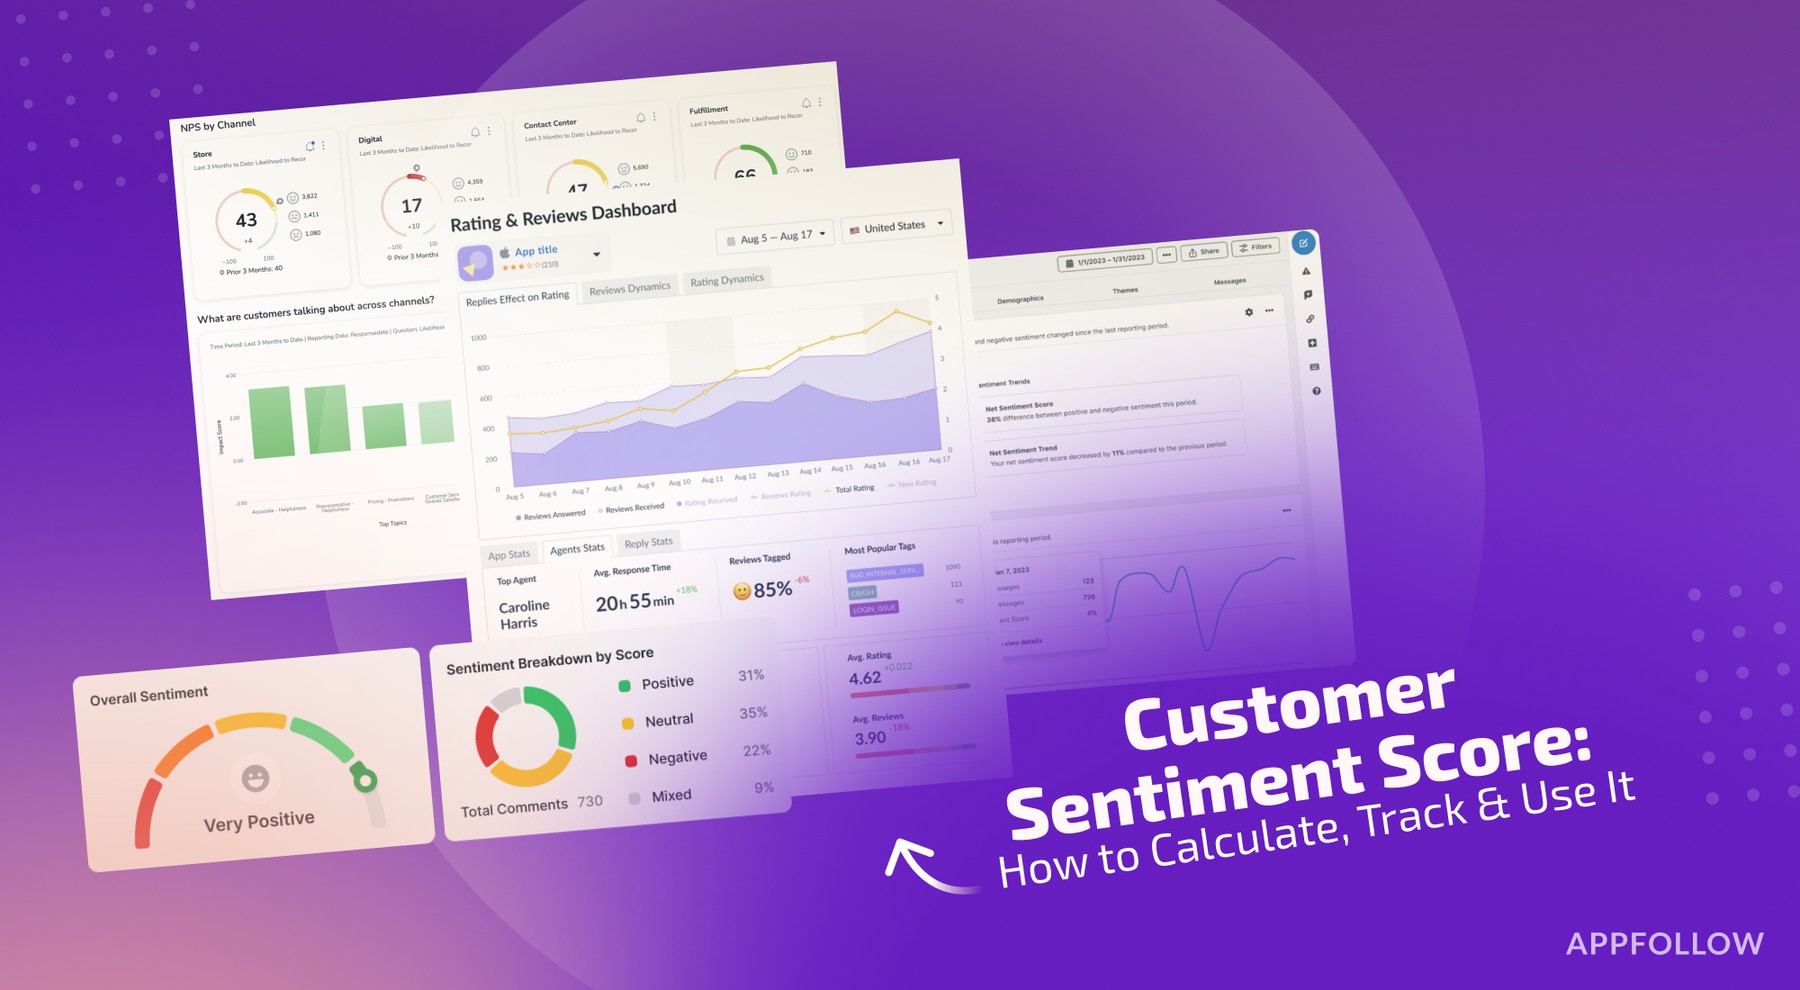
Ratings & Reviews performance provides an overview of what users think of your app. Here are the key metrics to help you identify how your app is rated by users and how successful is your review management strategy.
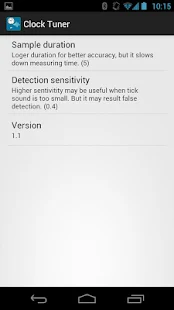
A Timegrapher This app is to measure the BPH(Beats per hour) of mechanical watches. It will display time error per day as well. The app uses microphone to measure BPH. ** Recommend to plug a microphone into phone and attach the microphone to the back of your watch. ** Basic version display wave graph and pulse interval histogram. ** Frequency display requires 'Premium' upgrade. ** Please test the app with your watch before you purchase 'Premium' upgrade. The app will work as Premium during 30 min. Not for digital clocks. Not working in noisy environment. Set microphone direction toward a clock. - Review from Mr. Kojima http://www.thewatchsite.com/index.php/topic,42142.0.html - Preset example Rolex or mechanical watch: Target frequency: 4 or 5Hz, Sample duration: 2Sec, Sensitivity: manual 50 Most pendulum clock: Target frequency: 1 or 2 Hz, Sample duration: 5 or 10 Sec, Sensitivity: medium FAQ. 1) in the settings there is a sensitivity option with a high, medium, low and 3 manual settings, can you explain how this changes the results It determines sound amplitude threshold for detecting clock sound. If your clock sound is loud you may reduce sensitivity. This will allow more environmental noises. If you increase the sensitive, you may measure hand watches. But small noise may measurement errors. 2) why does the detected frequency change between light grey, black and red Red means smaller drift during the measurement interval while grey means that measurement may have an error. 3) the average frequency does not always calculate, it stays at NaN The 'detected frequency' should be red continuously. 4) how do you calculate the pulse drift % abs(max detected frequency - min detected frequency) / detected frequency during 1 detection cycle. 5) what are the 2 graphs showing and what data are you using for the calculations The size of bars in the upper graph should be almost the same. The bottom shows amplitude of sound wave recorded from micro phone. 6) are newer versions of the app being developed ** You may provide sound sample by sending wav or mp3 file to admin@athumbcut.com